A scale cannot distinguish fat from other tissue. That makes the SURMOUNT-1 body-composition substudy especially useful: it examined what changed during substantial weight reduction with tirzepatide, rather than treating every lost kilogram as equivalent. In the analyzed subgroup, about three-quarters of the measured tissue loss was fat and one-quarter was lean mass. That does not mean participants lost one-quarter of their starting muscle.
The central finding is both encouraging and incomplete. Fat mass declined much more than lean mass relative to their respective starting amounts, but lean tissue still decreased. The study cannot establish how much skeletal muscle was lost or whether strength changed. This appraisal uses the available full body-composition article, its publisher correction, indexed primary-report abstracts for the parent trial and a separate heart-failure trial, and official FDA material—not an examination of every protocol or supplement.
At a glance
- Analyzed sample
- 160 participants had paired DXA measurements: 124 receiving pooled tirzepatide doses and 36 receiving placebo; approximately 73% were female.Sources: [1]
- Changes from baseline
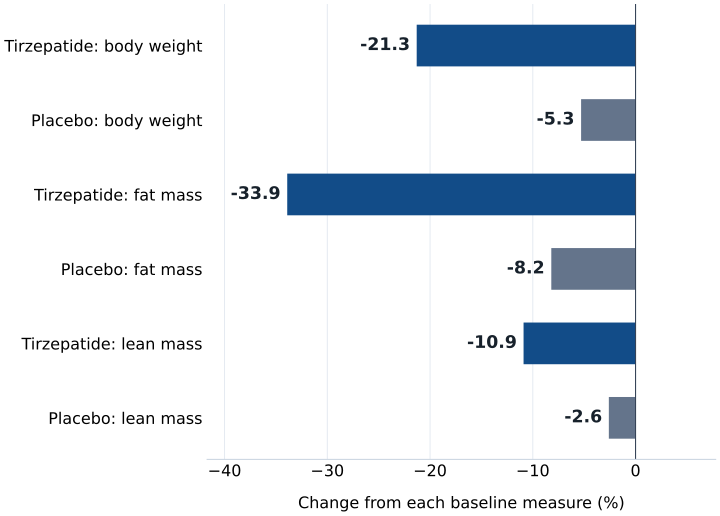
- At the Week 72 analysis, body weight, fat mass, and lean mass changed by −21.3%, −33.9%, and −10.9% with tirzepatide, versus −5.3%, −8.2%, and −2.6% with placebo.Sources: [1]
- What the 75/25 split means
- Approximately 75% of lost tissue was fat and 25% was lean mass in both groups. These are shares of loss, not percentages of starting muscle.Sources: [1]
- Corrected figure
- The August 2025 correction changed Figure 4 fat-mass and lean-mass axis units to kilograms, not percent; it did not change the abstract’s percentage-change results.Sources: [3]
- Safety context
- In the parent trial, gastrointestinal adverse events were most common, and adverse events caused discontinuation in 4.3%, 7.1%, and 6.2% of the tirzepatide dose groups versus 2.6% with placebo.Sources: [2]
A small imaging study inside a much larger randomized trial
SURMOUNT-1 randomized 2,539 adults without diabetes to once-weekly subcutaneous tirzepatide or placebo for 72 weeks, including a 20-week dose-escalation period. Eligibility required a body mass index of at least 30, or at least 27 with a weight-related complication. The 5-mg, 10-mg, and 15-mg doses identify research arms, not instructions for treatment.
The DXA substudy drew participants from 28 sites with suitable scanners. Of 255 enrolled in the substudy, 160 had baseline and end-of-study or early-discontinuation scans and entered the efficacy analysis. They averaged 46.2 years of age, 102.5 kg in body weight, and a BMI of 38.0; 73.1% were female and 75.6% were White.
Both groups received lifestyle counseling, so the comparison was tirzepatide plus that support versus placebo plus that support—not medication versus no care. The analysis pooled all three tirzepatide doses, producing 124 treated participants versus 36 controls. For the broader trial context, see our SURMOUNT-1 guide; its full-trial averages should not be substituted for these imaging-substudy results.
DXA measures lean tissue, not muscle performance
Dual-energy X-ray absorptiometry, or DXA, estimates body composition using X-rays at two energy levels. The study distinguished fat mass from lean soft tissue and bone mineral content. Its lean-mass measure excludes bone mineral but includes more than skeletal muscle: organs, water, and other nonfat soft tissues contribute to it.
The scanning procedures aimed to limit avoidable measurement variation. Each participant was to use the same scanner and software, with similar positioning, hydration status, and time of day. A blinded central reader evaluated scans. These safeguards strengthen comparisons over time, but they do not turn a lean-mass estimate into a direct measurement of muscle fibers, muscle quality, or force production.
This distinction matters because loss of lean tissue and loss of strength are related questions, not interchangeable outcomes. A person may carry less total weight while also having less lean tissue; the net functional consequence requires testing. The study did not directly measure strength or use a physical-performance battery to determine whether the observed tissue changes impaired movement.
STUDY DATA · GLP-1 Evidence Review
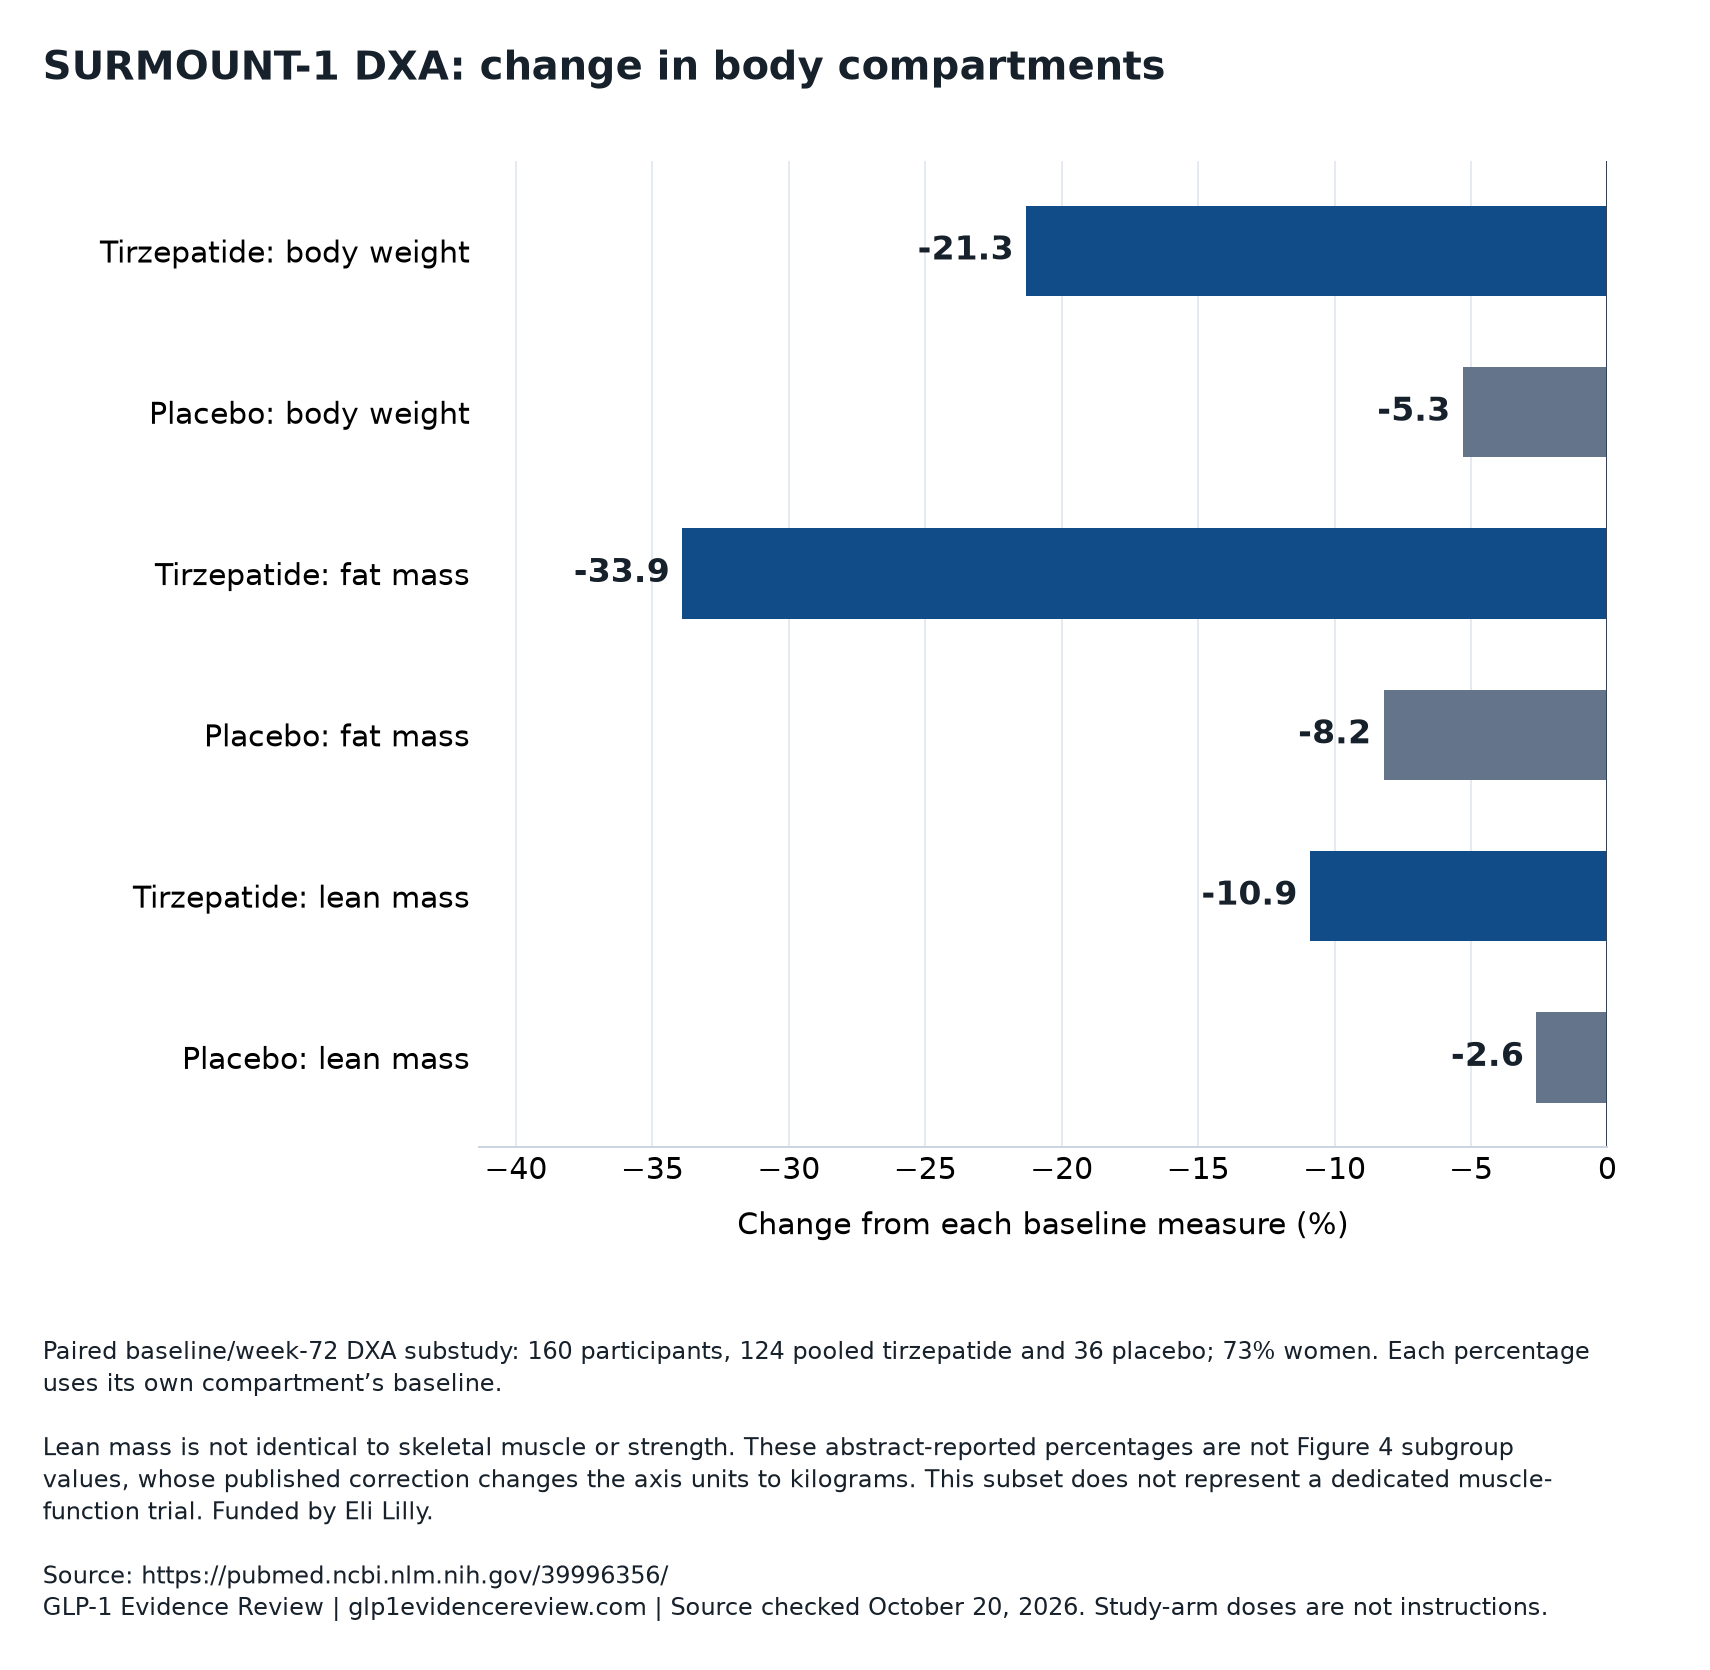
SURMOUNT-1 DXA: change in body compartments
Paired baseline/week-72 DXA substudy: 160 participants, 124 pooled tirzepatide and 36 placebo; 73% women. Each percentage uses its own compartment’s baseline.
| Study group | Change from each baseline measure (%) |
|---|---|
| Tirzepatide: body weight | -21.3 |
| Placebo: body weight | -5.3 |
| Tirzepatide: fat mass | -33.9 |
| Placebo: fat mass | -8.2 |
| Tirzepatide: lean mass | -10.9 |
| Placebo: lean mass | -2.6 |
Lean mass is not identical to skeletal muscle or strength. These abstract-reported percentages are not Figure 4 subgroup values, whose published correction changes the axis units to kilograms. This subset does not represent a dedicated muscle-function trial. Funded by Eli Lilly.
Original visualization of published aggregate data. No individual prediction or provider performance is represented. Original research ↗
Three percentage changes with three different denominators
The reported −21.3%, −33.9%, and −10.9% changes describe body weight, fat mass, and lean mass, respectively. Each percentage uses its own starting quantity as the denominator. A 33.9% reduction in fat mass does not mean fat loss equal to 33.9% of starting body weight.
The table preserves the percentage-from-baseline results reported in the abstract. Subtracting the placebo change from the tirzepatide change gives differences of −16.0 percentage points for body weight, −25.7 for fat mass, and −8.3 for lean mass. Those are differences between percentage changes—not relative risk reductions and not percentages of a single common tissue pool.
The confidence intervals for those adjusted differences were −19.4 to −12.6 percentage points for weight, −31.4 to −20.0 for fat mass, and −10.6 to −6.1 for lean mass. They support greater average reductions with tirzepatide in all three measures. They do not show the range of individual responses, as explained in our guide to trial averages.
| Measure | Pooled tirzepatide | Placebo |
|---|---|---|
| Body weight | −21.3% | −5.3% |
| Fat mass | −33.9% | −8.2% |
| Lean mass | −10.9% | −2.6% |
Why one-quarter of lost tissue is not one-quarter of starting muscle
The approximately 75/25 split answers a different question: of the fat-plus-lean mass lost, what fraction came from each compartment? The article calculates the fat share as fat loss divided by fat loss plus lean loss. The detailed overall estimates were 74% fat and 26% lean with tirzepatide, versus 75% and 25% with placebo.
For a purely illustrative loss of 10 kg divided 75/25, 7.5 kg would be fat and 2.5 kg lean tissue. Nothing in that calculation identifies the starting lean mass, much less starting skeletal muscle. To calculate the percentage of baseline lean mass lost, one must instead divide lean loss by baseline lean mass.
The observed absolute averages help connect those concepts. Tirzepatide participants lost an estimated 15.9 kg of fat and 5.6 kg of lean mass, compared with 3.6 kg and 1.2 kg on placebo. Calculating 5.6 divided by 15.9 plus 5.6 gives about 26%. Small differences from other summaries can reflect rounding and adjusted estimation; these are group results, not an exact accounting identity for every participant.
| Quantity | Calculation | What it means |
|---|---|---|
| Fat-mass percentage change | Fat-mass change ÷ baseline fat mass | How much the starting fat compartment changed |
| Lean-mass percentage change | Lean-mass change ÷ baseline lean mass | How much the starting lean compartment changed |
| Lean share of tissue lost | Lean loss ÷ (fat loss + lean loss) | How the measured loss was divided between compartments |
| Muscle strength change | Requires direct functional testing | Not established by the DXA percentages |
The endpoint hierarchy and the population actually analyzed
The substudy’s primary objective was to test whether pooled tirzepatide was superior to placebo for percentage change in fat mass. Lean-mass percentage change and absolute fat- and lean-mass changes were key secondary endpoints. The loss proportions, waist circumference, estimated visceral fat, and subgroup analyses were exploratory, post hoc analyses—questions examined after the main design was established.
Continuous outcomes were analyzed using analysis of covariance, which adjusted the treatment comparison for the baseline measurement. The absolute fat-mass difference was −12.3 kg, with a 95% confidence interval of −15.1 to −9.6 kg. For lean mass it was −4.4 kg, with a confidence interval of −5.6 to −3.2 kg. These estimates quantify additional average loss versus placebo, not total loss in the treated group.
An estimand specifies the treatment effect a study aims to estimate. The parent trial’s treatment-regimen estimand included outcomes regardless of treatment discontinuation. The DXA analysis instead required treatment exposure and nonmissing baseline and postbaseline scans; three missing Week 72 values were filled using the last available observation. Its selected analysis set should not be read as equivalent to the parent trial’s all-randomized comparison.
Missing scans and pooled doses limit the precision of the story
The 160 analyzed participants represent about 63% of the 255 people enrolled in the DXA substudy and about 6% of the parent trial. These calculations describe coverage, not a bias estimate. Randomization remains an important protection, but restricting analysis to people with usable paired scans can weaken that protection if availability is related to treatment tolerance or response.
The accessible report does not establish that missing scans were unrelated to outcomes. Last-observation-carried-forward imputation also assumes an earlier measurement is a suitable replacement for a later missing value, rather than observing what actually happened. Baseline similarity between groups cannot resolve every question about selection after randomization.
Pooling doses improves the number of treated participants available for comparison, but the headline result is not a dose-specific composition estimate. Nor was there adjustment for multiple statistical comparisons, which matters especially when examining many exploratory findings. Follow-up around 72 weeks also cannot establish the longer-term trajectory. Our SURMOUNT-4 analysis addresses a different maintenance-study design; it does not supply missing DXA follow-up here.
What the corrected figure and subgroup analyses can support
The publisher’s August 20, 2025 correction is specific: Figure 4’s fat-mass and lean-mass vertical axes should be labeled in kilograms, not percent. Figure 4 grouped tirzepatide participants by achieved weight reduction. Its corrected units describe absolute tissue loss; they must not be used as if they were percentage changes from baseline.
The correction does not revise the percentage results in the abstract. That is why the main comparison table above uses those reported baseline-relative percentages rather than reconstructing values from Figure 4. A mislabeled unit can materially change interpretation even when the underlying numeric values remain the same.
Post hoc analyses generally found similar loss proportions across age, sex, and weight-loss categories. However, the categories were small, and achieved weight loss is a post-treatment outcome, not a randomized assignment. Greater fat and lean loss among people who lost more weight does not establish a causal effect of belonging to that category. Broad consistency is informative, but it does not prove equivalent protection for older adults or people with low muscle reserves.
Less central fat is a finding; better strength remains a separate question
Beyond total fat, estimated visceral fat decreased by 40.1% with tirzepatide versus 7.3% with placebo. The adjusted difference was −32.8 percentage points, with a 95% confidence interval of −42.8 to −22.8. Waist circumference decreased by 18.1 cm versus 3.4 cm, an adjusted difference of −14.7 cm, with a confidence interval of −18.5 to −11.0.
These exploratory findings support reduced central adiposity, but the visceral-fat value came from scanner software estimating fat in an abdominal region, not a direct measurement of every internal fat depot. Neither finding establishes that a particular metabolic mechanism caused better health outcomes. The article also references improved self-reported physical function in the parent trial; questionnaire responses are not direct strength measurements.
For contrast, the separate STEP-HFpEF study tested semaglutide in 529 people with obesity and heart failure with preserved ejection fraction. At 52 weeks, its six-minute walk-distance difference favored semaglutide by 20.3 meters, with a 95% confidence interval of 8.6 to 32.1. That Novo Nordisk-funded trial illustrates direct performance testing, but its drug, population, and endpoints cannot answer the tirzepatide substudy’s missing muscle-function question.
Similar loss proportions do not erase adverse effects
The parent SURMOUNT-1 report provides the relevant randomized safety context. Gastrointestinal adverse events were the most common with tirzepatide, generally mild to moderate and occurring mainly during dose escalation. Adverse events nevertheless caused discontinuation in 4.3%, 7.1%, and 6.2% of participants assigned to 5 mg, 10 mg, and 15 mg, respectively, compared with 2.6% assigned to placebo.
Those discontinuation percentages are not rates of all adverse events, and they are not specific to the 160-person DXA sample. Likewise, a fat-to-lean loss proportion resembling placebo is not a comprehensive safety finding. Tirzepatide produced more absolute lean-tissue loss because the total reduction was much larger, leaving a meaningful question about which individuals might experience functional consequences.
The study did not analyze nutrient intake or physical activity in relation to composition outcomes, and it did not test a specific strength-training protocol. It therefore cannot establish a protein or exercise prescription that prevents lean loss. Further trials need direct strength and performance measurements, adequate representation of vulnerable older adults, and repeated measurements that connect tissue trajectories with function rather than assuming the connection.
What these results can—and cannot—establish outside the trial
Eli Lilly funded the substudy and participated in its design, data collection, analysis, interpretation, writing, and publication decision. Several authors were company employees and shareholders. That does not invalidate randomized findings, but it makes transparent methods, the corrected figure, and careful separation of primary from exploratory conclusions especially important.
The results concern the studied subcutaneous intervention under trial conditions. They do not establish equivalent composition changes for oral routes, other formulations, or compounded preparations. FDA states that compounded drugs are not approved or reviewed before marketing for safety, effectiveness, or quality. Its concerns include dosing errors and semaglutide salt ingredients; spontaneous reports alone cannot establish event rates or causation. See the approved-versus-compounded guide for that evidence distinction.
Editorial interpretation: a trial average cannot establish a provider’s monitoring quality, contract value, or expected customer outcome. Anyone comparing services can use the CoreAge Rx documentation review to check documentary terms, without assuming that provider offers the studied product or condition-specific care. The scientific result remains a treatment comparison in a defined research population, not a telehealth-company performance measure.
Questions & answers
Did participants lose 25% of their muscle?
No. Approximately one-quarter of the measured fat-plus-lean tissue loss was lean mass. That denominator is the amount lost, not starting muscle. The tirzepatide group’s lean-mass reduction was 10.9% relative to baseline lean mass, and DXA lean mass includes water, organs, and other soft tissues as well as muscle.
Does a similar fat-to-lean loss ratio mean tirzepatide preserved lean mass?
Not in the sense of preventing its loss. Tirzepatide participants lost more lean mass in absolute terms than placebo participants: an estimated 5.6 kg versus 1.2 kg. The similar ratio indicates a broadly similar division of a much larger total loss, not unchanged lean tissue or demonstrated preservation of strength.
Did the 2025 correction change the headline findings?
The correction changed Figure 4’s fat-mass and lean-mass axis units from percent to kilograms. It did not change the abstract’s percentage changes. Readers should distinguish the corrected figure’s absolute losses by weight-loss category from the baseline-relative percentages used in the principal comparison.
Can these results show that one medication protects muscle better than another?
No. This substudy compared pooled tirzepatide doses with placebo, not another active medication. Comparing body-composition percentages across unrelated trials can confound differences in participants, weight reduction, measurement procedures, missing data, and analysis. Establishing comparative muscle preservation would require an appropriate direct comparison and muscle-specific or functional outcomes.
What would make the next study more clinically useful?
Repeated DXA measurements paired with strength tests, walking or chair-rise performance, and patient-reported function would help connect tissue loss with daily capability. Better characterization of nutrition, activity, missing scans, and people with low muscle reserves would also help. The current findings identify these questions but do not determine individualized prevention strategies.
Our assessment
The strongest conclusion is that, in a selected SURMOUNT-1 imaging sample, tirzepatide produced substantially greater fat loss and greater lean-tissue loss than placebo, with roughly similar proportional partitioning of the loss. Fat declined more rapidly relative to its starting compartment, supporting an improvement in measured composition. The unresolved issue is not whether lean mass decreased—it did—but what that decrease meant for skeletal muscle, strength, and longer-term function in different people. The study is useful evidence about tissue compartments, not proof of universal muscle preservation or a basis for provider rankings.
Sources & documentation
Scientific and official sources consulted October 20, 2026. Study findings apply to the populations, products and time periods described; they are not provider outcome data.
- Body composition changes during weight reduction with tirzepatide in the SURMOUNT-1 study of adults with obesity or overweight. ↗
- Tirzepatide Once Weekly for the Treatment of Obesity. ↗
- Correction to "Body composition changes during weight reduction with tirzepatide in the SURMOUNT-1 study of adults with obesity or overweight". ↗
- Semaglutide in Patients with Heart Failure with Preserved Ejection Fraction and Obesity. ↗
- FDA concerns about unapproved GLP-1 drugs ↗